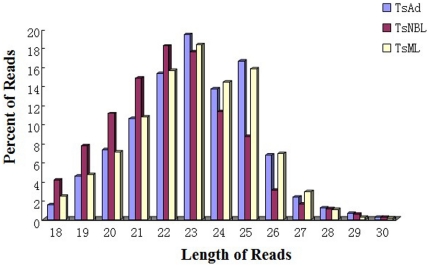
Figure 2. Length distribution of small RNAs in different developmental stages.
Length of small RNAs is given on the x-axis in base pairs. And he left Y-axes indicate the percentage of small RNAs afer removal of low quality sequences but prior to selection for complete matches to the genome sequence.

