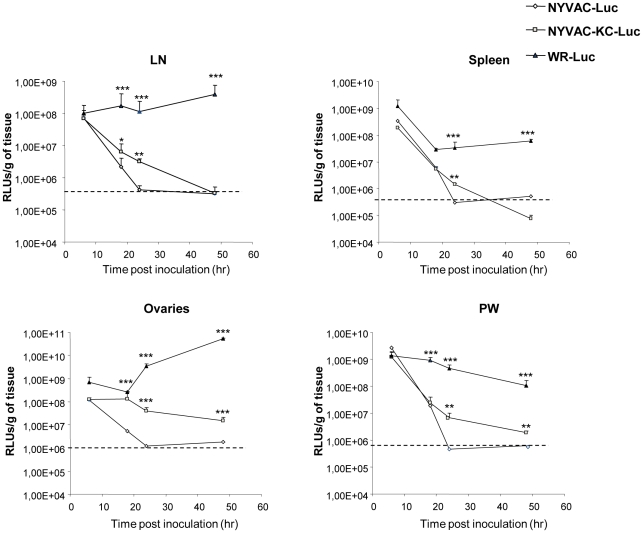
Figure 8. Comparative levels of luciferase in mice infected with parental NYVAC versus NYVAC-C-KC.
Mice were infected IP with 2×10⁷ plaque forming units/mouse of viruses (WR-luc, NYVAC-luc and NYVAC-KC-luc) expressing the luciferase marker and at different times several tissues were harvested, lysed and luciferase activity was determined as previously described [12], [13]. Values are represented as reference luciferase units per gram of tissue.

