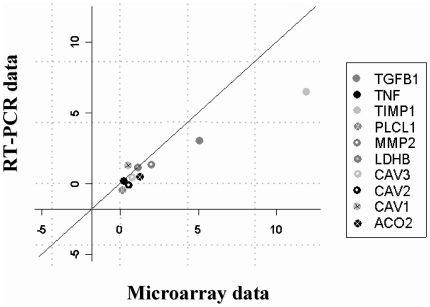
Figure 2. Independent verification of microarray results by quantitative RT-PCR for a group of selected genes in a DMD patient.
Scatterplot illustrating the good concordance for 10 gene expression values measured by RT-PCR (y axis) and Microarray (x axis) in one of the DMD samples. Each spot represents mean expression value measured for one gene either by RT-PCR (n = 3) or by microarray experiment. The diagonal line denotes the identity between RT-PCR and microarray expression values. Measured genes are listed in legend. RT PCR expression values are well correlated with microarray expression values (Pearson's correlation r = 0.88).

