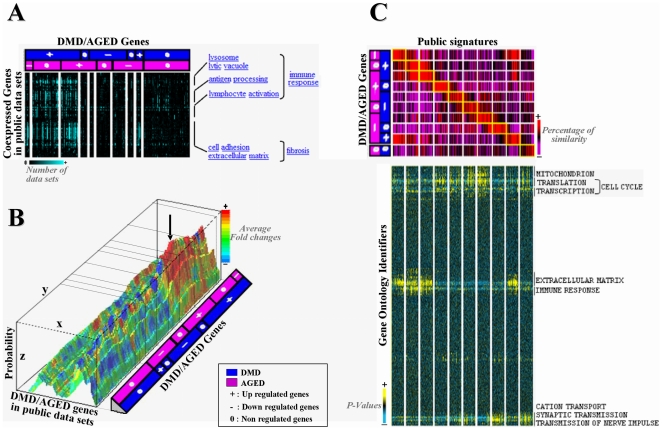
Figure 4. Blind validation: Meta-analysis across a wide panel of public studies.
A- Meta-clusters of co-expressed genes: hierarchical clustering was applied to genes commonly extracted from our DMD/AGED meta-clusters in one hand (column) and 1,471 Gemma microarray data sets on the other hand (line). Each cell of the matrix corresponds to the number of data sets were a gene is found significantly co-expressed to the other. Light blue is attributed to high number of co-expressed genes and black to small number co-expressed genes. Functional annotation of highly co-expressed gene clusters was performed (right hand). Genes associated to immune response and fibrosis were found to be co-expressed in our DMD/AGED meta-clusters and a high number of Gemma data sets. B- Meta-clusters of data sets having similar significant fold-changes: hierarchical clustering was applied to fold changes values extracted from our DMD/AGED meta-cluster in one hand (y axis) and 1,515 data sets extracted from GeneChaser on the other hand (x axis). Each point of the x;y matrix corresponds a significant fold change value. Each fold change value is associated to a rainbow color palette: fold change values upper than 1 are with hot colors and fold values lower than 1 are with cold colors. z axis corresponds to probability associated to this fold-change to be true. The arrow delimits a cluster of studies associated to invasion processes where relevant similar fold changes are observed. C- Top panel: heat map presenting overlapping similar signatures: gene composition of our 10 DMD/AGE meta-clusters ( = signatures) (horizontally), is compared to ∼20,000 public transcriptional signatures (vertically). Those 20,000 signatures were extracted from ∼1,500 microarray dataset using TBrowser. Each cell corresponds to a percentage of similarity in gene composition between each gene list. A color code is attributed to each cell: red for good percentage of similarity and purple for bad values. For each meta-cluster, the 50 top overlapping clusters from the database were retained. Bottom panel: horizontal hierarchical clustering of best hit public signatures (columns) on the basis of their enrichment p-value found in Gene Ontology (row). A color code is attributed to each p-value (cell): yellow<black<blue. Some public signatures extracted from comparison to our DMD/AGE signatures all gather in same GO annotated functions: mitochondrion, cell cycle, extra cellular matrix, immune response, and nerve transmission.

