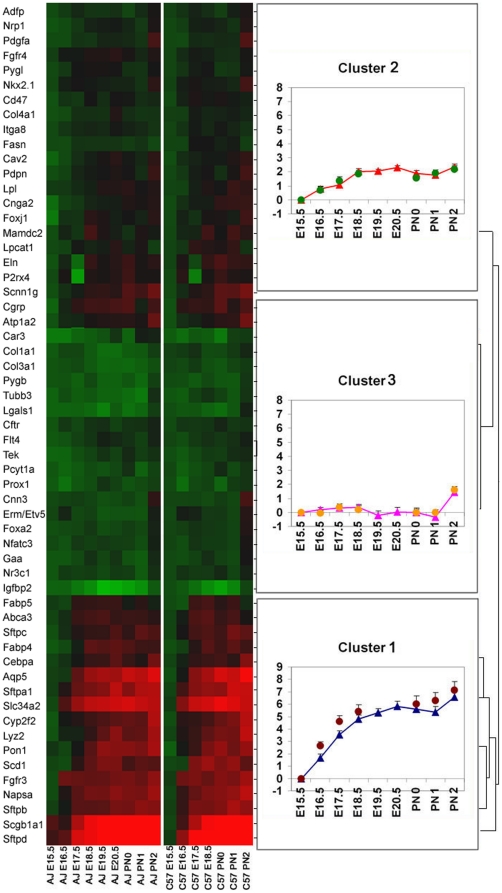
Figure 4. Strain and length of gestation influence gene expression in the developing lung.
mRNA levels encoding 53 proteins associated with lung maturation were measured by qRTPCR. mRNAs were clustered hierarchically into three distinct groups. The heat map (left panel) was generated using log2-transformed data and complete linkage to calculate distance between clusters. The mRNA profile charts (right panels) of three clusters of genes were generated based on normalized mean ± SEM within each gene cluster. Triangles and circles represent the normalized group mean expression value of A/J and C57BL/6J mice, respectively, at each gestational time point. The X-axis represents gestational time points. The Y-axis represents relative expression normalized to the E15.5 value of each respective strain.

