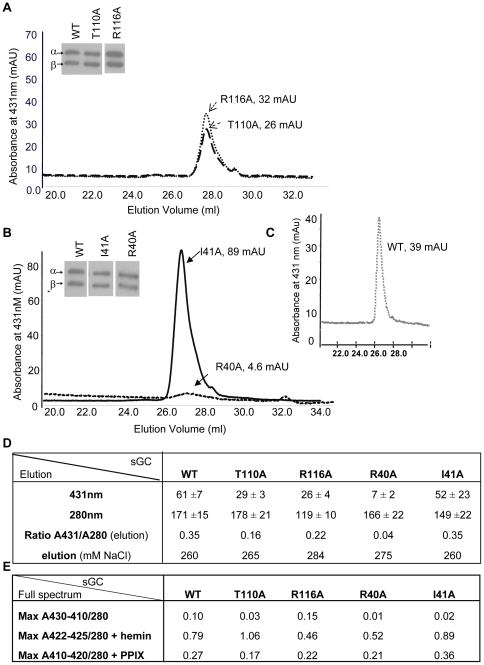
Figure 2. Purification of Wild Type and mutants.
2A–B: representative spectra of purification of mutants at 431 nm, the expected absorbance for the heme-containing enzyme. All mutants had similar levels of expression as assessed by immunoblot with antibodies against α and β subunit of sGC after electrophoresis of ∼0.5 µg of semi-purified protein on a 7.5% Tris-HCl gel (insets). 2C: representative elution profile of purification of WT. 2D: Table of purification with ratio of heme-containing sGC (431 nm) over protein total concentration (280 nm) from the elution, measured as described in Material and Methods ; values are expressed in absorbance unit (mAU). Elution as a function of salt concentration is indicated (NaCl, mM). Measurement at 393 nm to estimate oxidized heme-containing sGC was not significantly different between WT and mutants (not shown). 2E: Table of full spectrum values. UV-vis was recorded as described in Material and Methods (see also Figure S3) and the ratio of maximum absorption for WT and mutants between 410 and 430 nm over maximum absorption at 280 nm was calculated in the absence or presence of hemin (5 µM) and PPIX (5 µM) after heme reduction with 5 mM DTT. Max: Maxima. Each mutant was purified at least three times (±S.E.M.) and WT was purified six times (± S.E.M.). UV-vis collection of the various Soret bands for WT and mutants are shown in Figure S3 and Figure S4.

