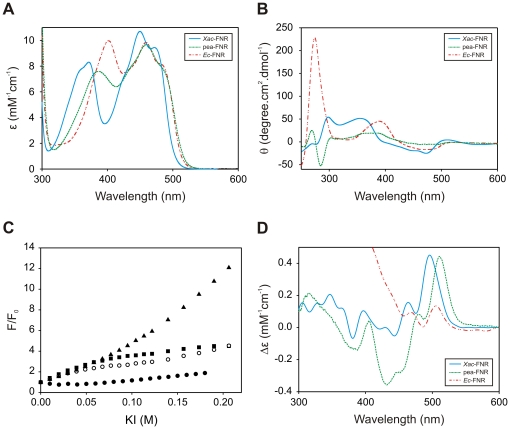
Figure 4. Spectroscopic analyses of Xac-FNR and comparison with the pea and E. coli enzymes.
(A) UV-visible spectra displayed by the different plant-type FNRs. (B) Near-UV and visible CD spectra of the enzymes. (C) FAD solvent accessibility studied by quenching with KI. Xac-FNR (○), pea-FNR (▪), Ec-FNR (•), free FAD (▴). (D) Differential UV-visible spectra elicited by the interaction between the enzymes and NADP+. The spectra were obtained by the subtraction of the spectra of FNR in the presence of 0.3 mM NADP+ and the free enzyme. Different colors were employed for each FNR variant: cyan, Xac-FNR; green, pea-FNR; and red, Ec-FNR.

