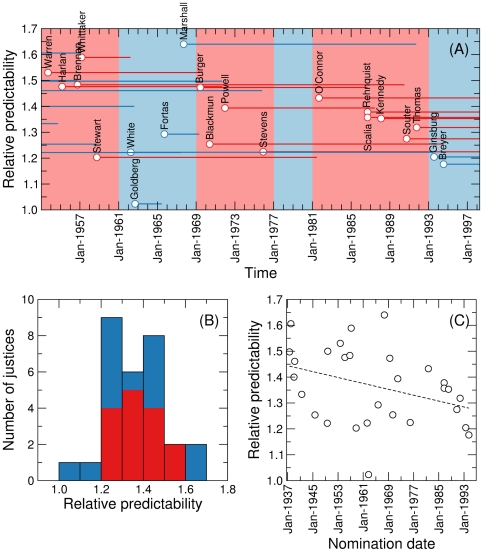
Figure 3. Relative predictability of individual U.S. Supreme Court justices.
(A) Each line indicates the average relative predictability (that is, predictability according to the block model algorithm in the real court over the predictability in an equivalent ideal court) of a justice over their tenure, which is indicated by the length of the line. Red lines correspond to Republican–nominated justices and blue lines to Democrat–nominated justices. The background color indicates the party of the president. (B) Histogram of relative predictabilities. Bar colors indicate the fraction of Republican–nominated (red) and Democrat–nominated (blue) justices within each bin. (C) Relative predictability as a function of the nomination date of the judge. Relative predictability has significantly decreased during the period considered (p = 0.026, Spearman's rank correlation), as indicated by the dashed line (which is only shown as a guide to the eye).

