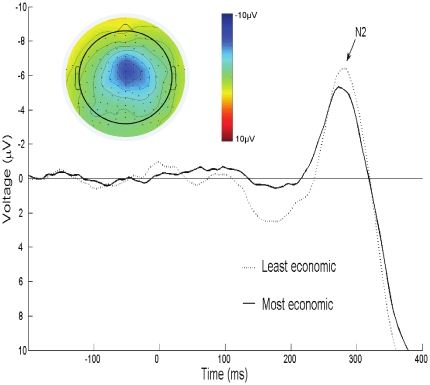
Figure 4. ERP waveforms.
Waveforms corresponding to correct No-Go responses, with the waveform for correct Go responses subtracted, for the least and most economic ultimatum game responders are shown (stimulus presented at 0 ms; N2 peaked at 278 ms at Cz). The inset shows the voltage map of the scalp distribution of the resulting N2.

