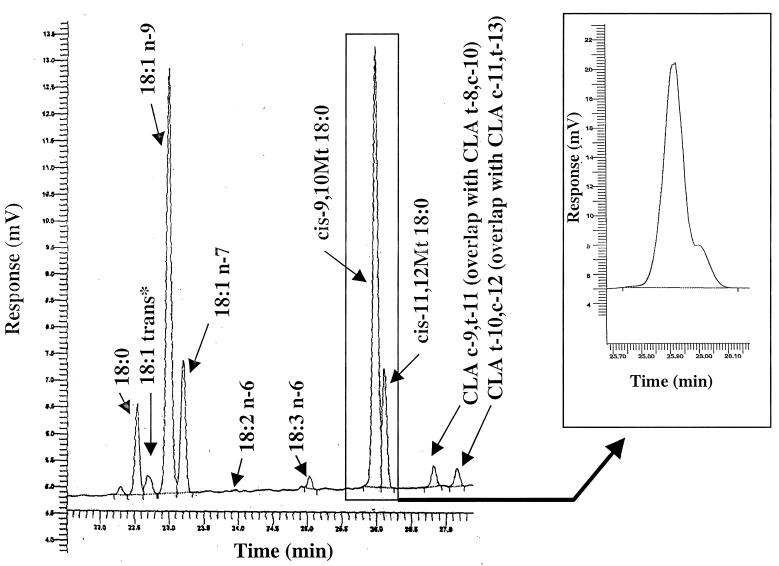
FIG. 1.
Enlarged chromatogram of the region of the 18:0, 18:1, and CLA isomers. The chromatogram represents the cellular fatty acids of Lactobacillus GG cultured in standard, non-PUFA-supplemented MRS broth. The cyclopropenic acid region of another chromatogram (Lactobacillus GG cultured in α-linolenic acid-supplemented MRS broth) is shown in the inset. An asterisk indicates identification of a peak not based on the standard.

