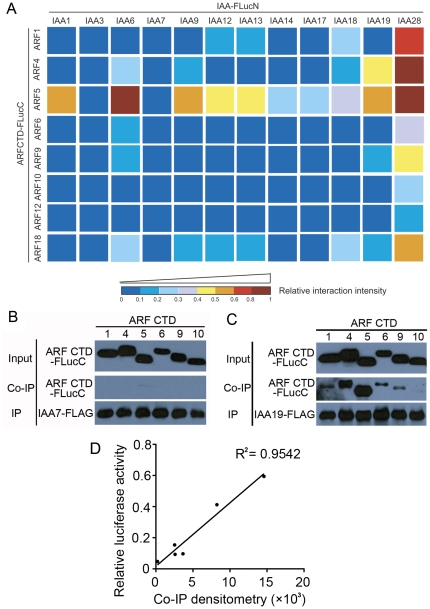
Figure 3. Binary interaction analysis between 12 Aux/IAAs and 8 ARFs by the SFLC assay.
(A) The 96 different combinations between 12 Aux/IAA-FLucN and 8 ARFCTD-FLucC proteins resulted in huge differences in the restored luciferase activity, which reflected diverse PPI intensities. At least three biological replicates were assayed for each Aux/IAA-ARF combination and similar interaction patterns were obtained. Quantitative data are provided in Table S1. The relative interaction intensity of a given combination was generated by standardizing its restored luciferase activity against that of ARF5CTD-FLucC and IAA28-FLucN, and is presented in a heat map, with the coldest color (dark blue) indicating the lowest interaction intensity and the hottest color (dark red) indicating the highest interaction intensity. The color bar indicates the range of relative interaction intensity corresponding to each color. (B) None of the 6 well-expressed ARF CTD proteins could be co-precipitated with the IAA7-FLAG protein during co-immunoprecipitation. (C) Diverse amounts of the 6 ARF CTD proteins were co-precipitated with the IAA19-FLAG protein during co-immunoprecipitation. In (B) and (C), 100 µg of IAA7-FLAG or 20 µg of IAA19-FLAG construct was co-expressed with 100 µg of indicated ARFCTD-FLucC construct in an excessive amount of protoplasts (5×10⁵ cells) for 6 hr, and a modest amount (10 µl of 50% slurry) of anti-FLAG M2 agarose beads were used for immunoprecipitation in order to pull down comparable amounts of Aux/IAA proteins. (D) Positive correlation between the immunoblot signal from (C) determined by densitometric analysis using Image J program and the corresponding SFLC results from (A) and Table S1.

