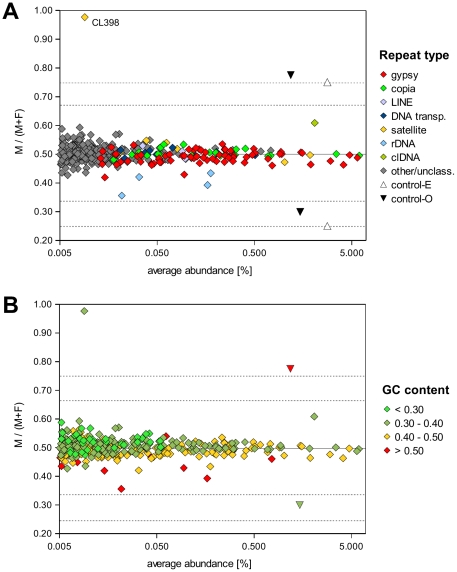
Figure 3. Comparison of genomic proportions of individual repeat families in male and female genomes.
Symbols on the plot representing individual clusters are color-coded according to the repeat type (A) or proportion of GC in their sequences (B). The position along the X-axis corresponds to the average proportion of the repeat in male and female genomes, while its position along the Y-axis is determined by its relative abundance in male (M) and female (F) genomes. This is expressed as the repeat proportion in the male divided by the sum of its proportions in the male and female genomes, resulting in the value of 0.5 for sequences with the same proportions in male and female genomes (marked by a solid line on the graph). The dashed lines mark two- and three-fold enrichment of a sequence in the male (corresponding to the values of 0.67 and 0.75, respectively) and female (0.33 and 0.25, respectively) genome. The positions of the sequence quantification controls are marked by triangles, showing their expected (open symbols) and observed (black symbols) values.

