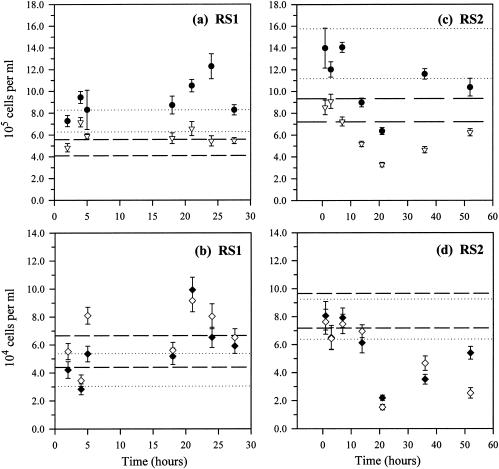
FIG. 1.
Effects of storage without preservatives: temporal changes in total microbial abundance estimated by DAPI staining (•) and eubacterial abundance estimated with EUB338 (▿) in RS1 (a) and RS2 (c) and temporal changes in β-AOB abundance detected with NSO190 (♦) and with NSO1225 (⋄) in RS1 (b) and RS2 (d). (a and c) The dotted and dashed lines indicate the 95% confidence intervals (95% CI) of DAPI and EUB reference values, respectively. (b and d) The dotted and dashed lines are the 95% CI of the NSO190 and NSO1225 reference values, respectively. Please note the longer time scale used for RS2 in panels c and d. Error bars, standard deviations.

