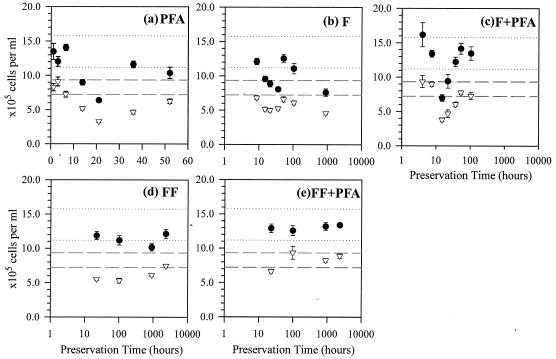
FIG. 3.
Total microbial abundance estimated by DAPI staining (•) and eubacterial abundance by EUB338 in sample series RS2 preserved with paraformaldehyde (pfa) (a), formaldehyde (F) (b), combined formaldehyde-paraformaldehyde (F+pfa) (c), formaldehyde-freezing (FF) (d), and combined formaldehyde-freezing-paraformaldehyde (FF+pfa) (e). Dashed lines show the 95% CI of the EUB reference, and the dotted lines show the 95% CI of the DAPI reference. Note that the time scale is linear in panel a but logarithmic in panels b to e. Error bars, standard errors.

