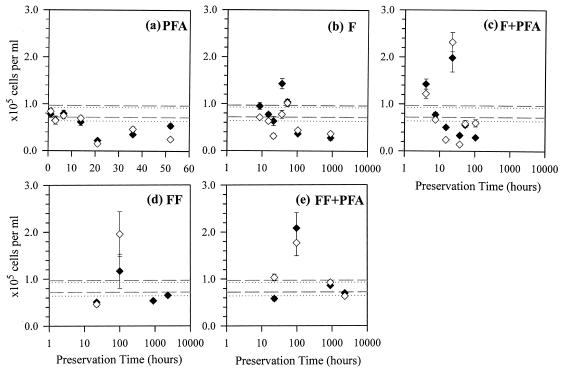
FIG. 4.
Abundance of β-AOB detected with NSO190 (♦) and with NSO1225 (⋄) in RS2 subsamples preserved by the PFA (a), F (b), F+PFA (c), FF (d), and FF+PFA (e) methods. Dashed lines show the 95% CI of the NSO1225 reference, and the dotted lines show the 95% CI of the NSO190 reference. Note that the time scale is linear in panel a but logarithmic in panels b to e. Error bars, standard errors.

