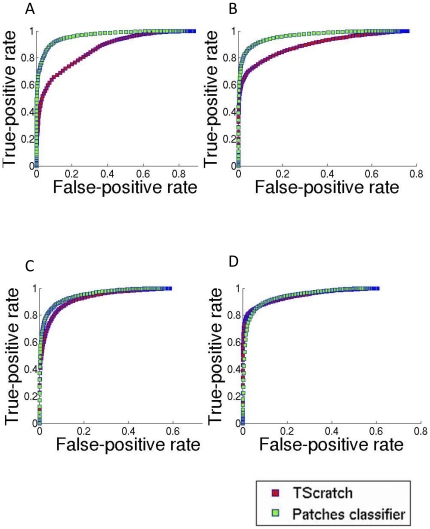
Figure 3. Segmentation results: ROC curves.
Receiver operating characteristic (ROC) curves (red – TScratch, green – MultiCellSeg's patch classifier). The x-coordinates represent the false-positive rate; the percent of image's pixels that were classified incorrectly to background pixels out of all cellular pixels. The y-coordinates are the true-positive rate; the percent of background pixels tagged correctly out of all image's background pixels. Each curve was produced by averaging the ROC curves of all images in the data set. (A) Init: single well DA3 cells acquired at high temporal resolution (28 images), (B) SN15: multi-well DA3 cells taken at different imaging conditions (54 images), (C) Melanoma: brain metastatic melanoma cell lines (20 images), (D) TScratch: all available TScratch's sample images taken from http://www.cse-lab.ethz.ch/index.php?&option=com_content&view=article&id=363, containing cell lines with various morphologies (24 images).

