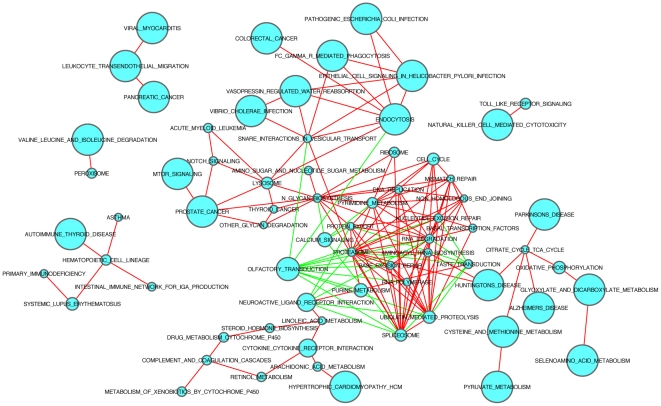
Figure 2. Correlation network of the KEGG pathways.
Each node represents a KEGG pathway. The pathways that are positively (>0.75) or negatively (<−0.75) correlated are connected by "red" and "green" edges, respectively. The size of a node indicates the number of genes in the corresponding pathway. The details are accessible in high-resolution images linked from the website.

