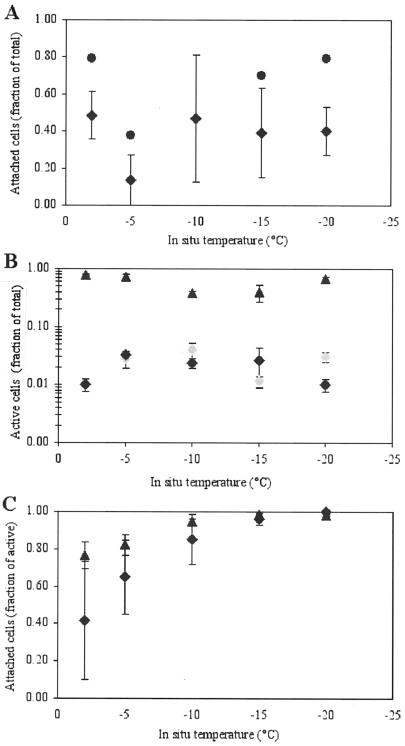
FIG. 3.
Fractions of total bacteria that were attached (A) or active (B) and fractions of active cells that were attached (C) across the temperature gradient in wintertime sea ice. Circles indicate data from intact ice sections examined microscopically. Diamonds indicate mean values from isothermal-isohaline-melted ice samples used for CTC incubations: black diamonds indicate samples from the Chukchi Sea, and gray diamonds indicate samples from Elson Lagoon. Triangles indicate mean values from isothermal-isohaline-melted ice samples used for rRNA probing. Error bars indicate the SEM (n = 3).

