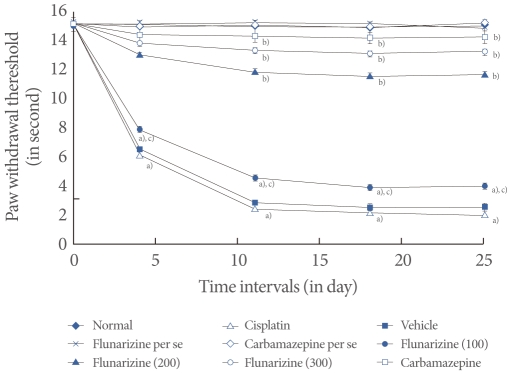
Fig. 3.
Effect of flunarizine on the plantar test. Data in parentheses indicate the dose of flunarizine in µM/kg. Values are the mean±SD of 6 animals. Statistical values for plantar test F (8, 53)=173.103; P<0.001. a)P<0.05 vs. sham control group. b)P<0.05 vs. cisplatin control group. c)P<0.05 vs. carbamazepine treated group.

