Figure 3.
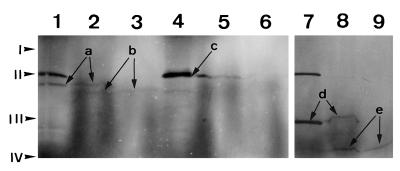
Import of polypeptides into chloroplasts. Incubation of radiolabeled, in vitro-synthesized polypeptides with isolated chloroplasts and SDS-PAGE were performed as described in Methods. An autoradiogram of the gel is shown. Lanes 1 to 3, Analysis of import of PRPP synthase isozyme 2; lanes 4 to 6, analysis of import of PRPP synthase isozyme 3; and lanes 7 to 9, analysis of import of the D-polypeptide of barley PSI. Lanes 1, 4, and 7, In vitro translation products; lanes 2, 5, and 8, reaction products of incubation of in vitro translation products with chloroplasts; lanes 3, 6, and 9, reaction products as in lanes 2, 5, and 8, respectively, but treated with the protease thermolysin. Arrows labeled “a” point to the bands representing the in vitro-synthesized 43-kD PRPP synthase isozyme 2 polypeptide. Arrows labeled “b” point to the bands representing the 39-kD processed PRPP synthase isozyme 2 polypeptide. The arrow labeled “c” points to the band representing the in vitro-synthesized 47-kD PRPP synthase isozyme 3 polypeptide. This band contained two polypeptides, with the lower one representing the PRPP synthase isozyme 3 polypeptide. Arrows labeled “d” point to the bands representing the in vitro-synthesized D-polypeptide of PSI (28 kD). Arrows labeled “e” point to the bands representing the processed D-polypeptide of PSI (21.5 kD). The band at 48.5 kD present in lanes 1, 4, and 7 is an artifact that originates from the presence of an endogenous template in the transcription-translation mixture, because the band was also present in transcription-translation reactions to which no template was added (data not shown). Positions of the molecular-mass markers are indicated at the left: I, BSA (66 kD); II, ovalbumin (46 kD); III, carbonic anhydrase (30 kD); and IV, trypsin inhibitor (21.5 kD).

