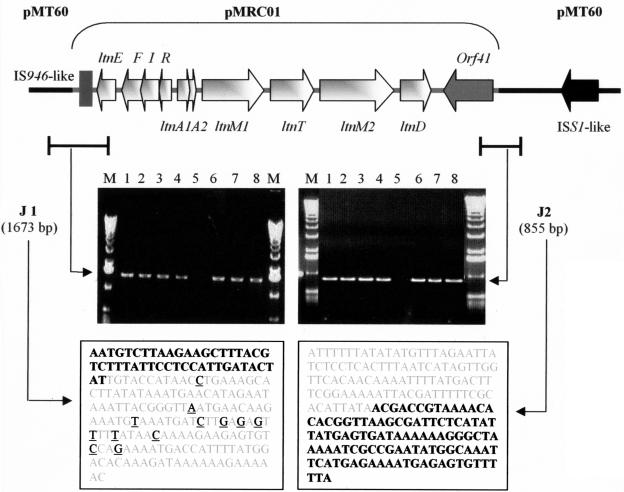
FIG. 4.
Schematic representation of the 17-kb fragment of pMRC01, encompassing the lacticin 3147 production and immunity gene clusters, inserted into pMT60, creating pMRC02. Arrows indicate ORFs and directions of transcription. Junction sites of pMRC02 are indicated (J1 and J2, respectively). Agarose gel electrophoresis shows PCR amplification of these junction sites by use of the primers listed in Table 2. Lanes 1, DPC5559; lanes 2, DPC5560; lanes 3, DPC5561; lanes 4; DPC4275; lanes 5, negative control; lanes 6, DPC5564; lanes 7, DPC5565; lanes 8, DPC5566. M, Molecular weight marker X (Roche Diagnostics). Text boxes contain the junction site sequences. pMT60 DNA is indicated in bold, while pMRC01 DNA is indicated in gray. Base pair differences between the junction sites and pMRC01 are underlined.

