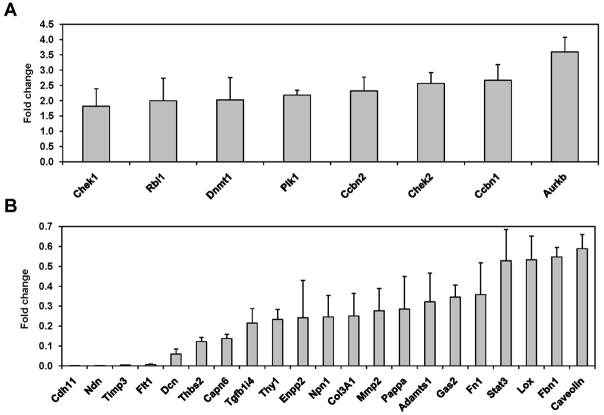
Fig. 4. Validation by real time RT-PCR of the up- and down-regulated genes obtained using the expression display approach.
Total RNA from SV5 and SV5-NN4 cells, was purified and the mRNA levels of selected up-, A, and down-regulated genes, B, were analyzed by real time RT-PCR in SV5 and SV5-NN4 cells. Fold change was calculated using the Mgst3 gene as control, which was equally expressed on the different microarrays. Data represent the mean of 3 PCR amplifications expressed as fold-increase/decrease compared with SV5 cells.

