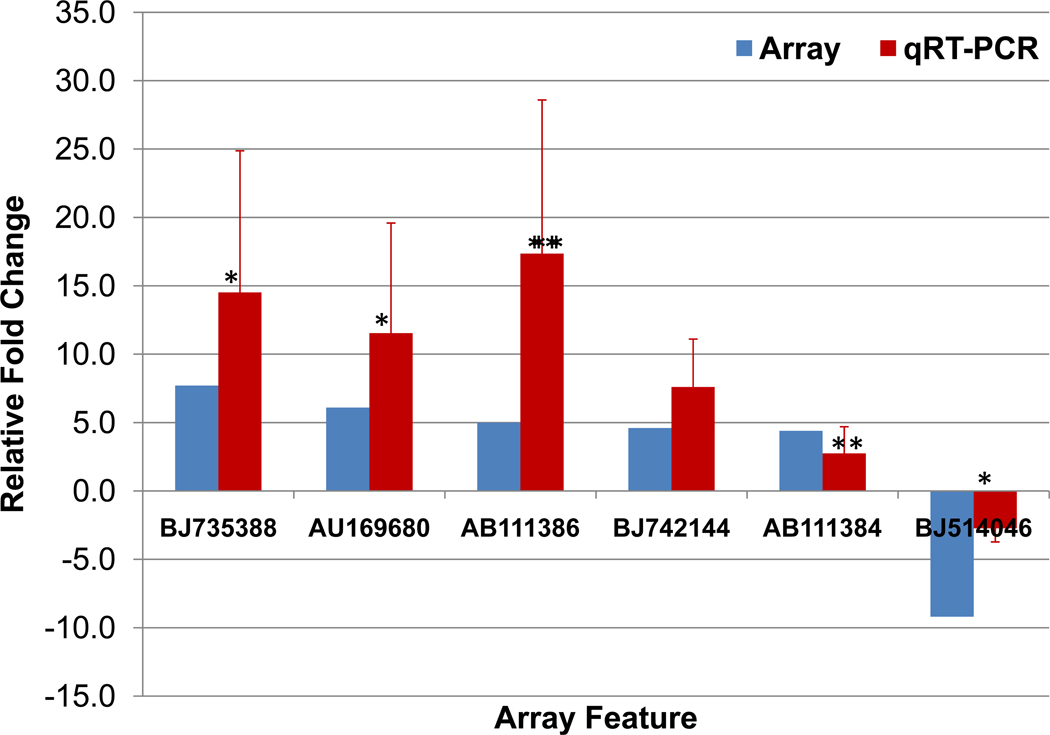
Figure 2. Comparison of array and qRT-PCR fold changes for select features with gene expression responses (≥ ±4-fold) in medaka fin tissue.
Six features with greater than 4-fold induction or suppression in the array (blue column) were examined by qRT-PCR (red column). The qRT-PCR relative expression for each hypoxic sample was based on normalization to 18 S rRNA. Fold changes were the average hypoxic organ tissue sample (n=3) realitive to normoxic sample from the same organ tissue. * Represents p≤ 0.01 and ** represents p ≤ 0.05

