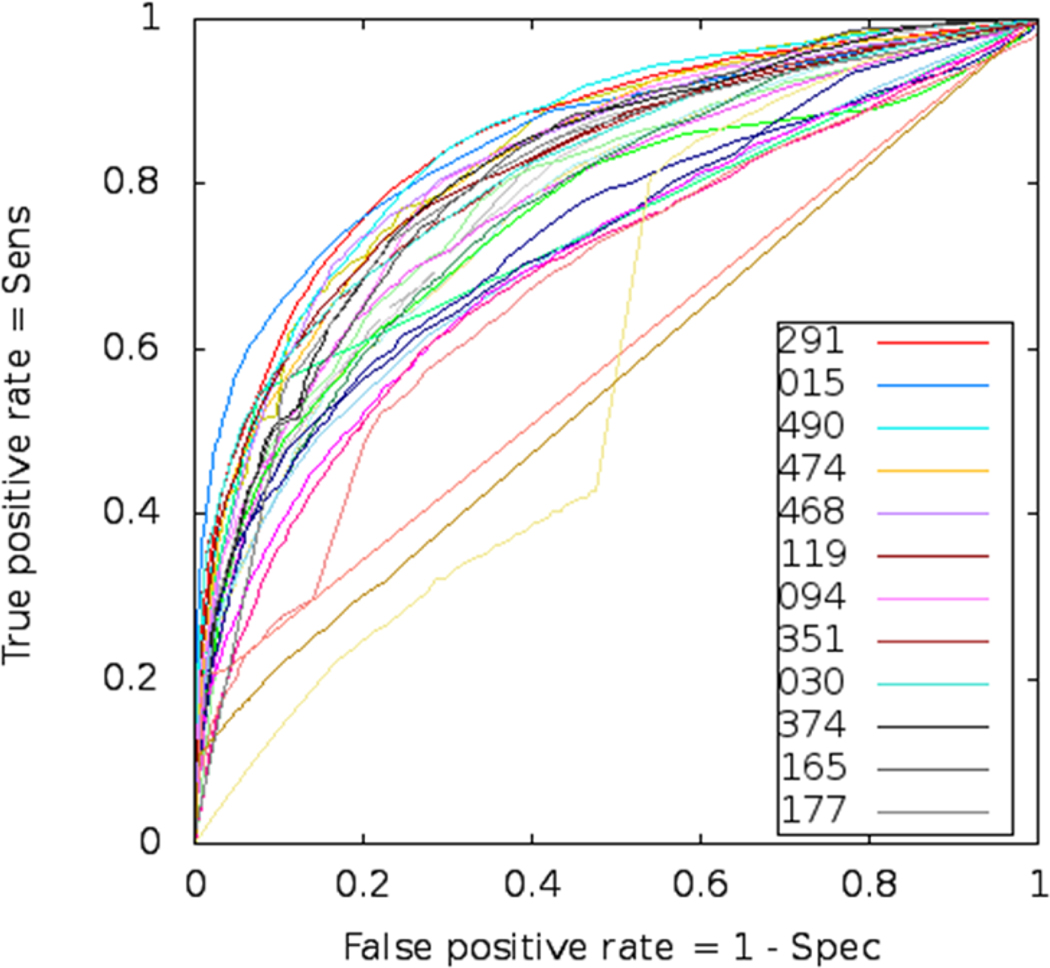
Figure 3.
ROC curves of disordered region predictions for all CASP9 groups. Legends are shown for the best 12 groups according to the AUC. There are four non-regular ROCs corresponding to poorly performing groups, two of which misinterpreted DR format (G193 used only a single value for ordered residues and G114 did not use continuous scale but rather 5 different numbers).

