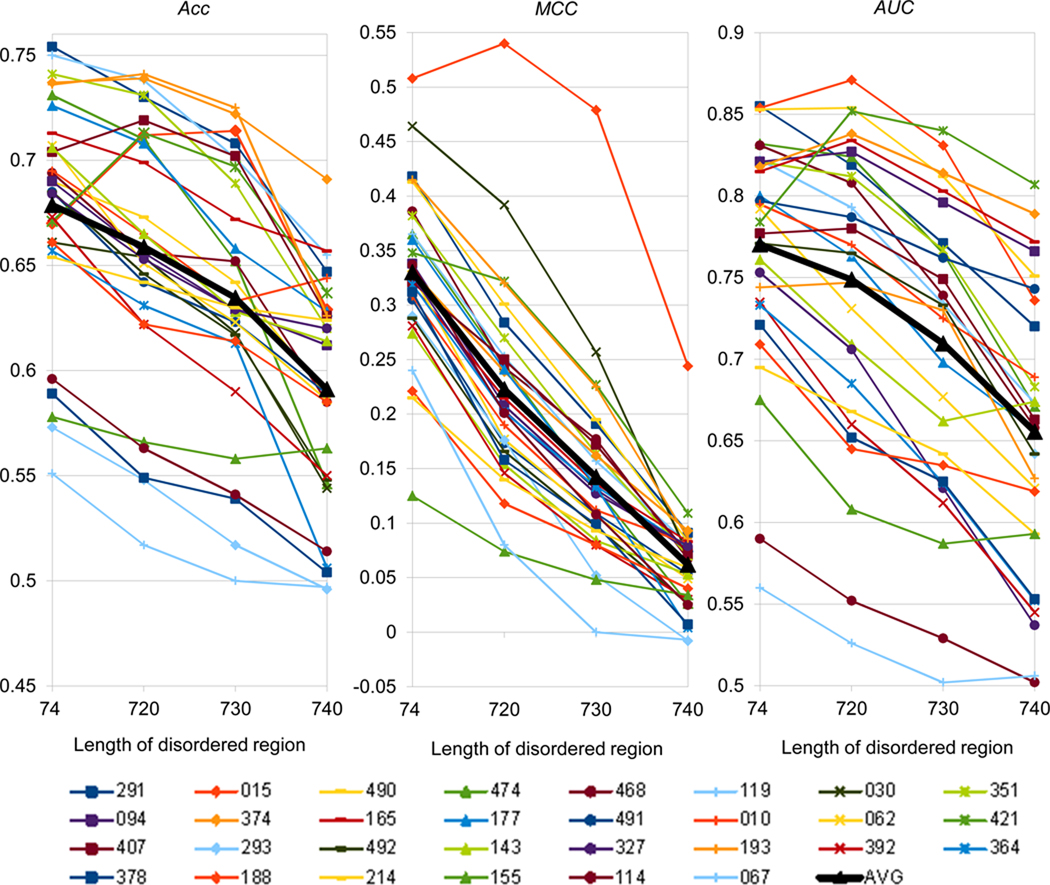
Figure 4.
Comparison of prediction performance across four different minimum disorder segment length thresholds. Different panels show scores for different evaluation measures (Acc, MCC and AUC). Each group is marked with a different color; groups in the legend are sorted according to the AUC score (across and then down); the artificial average group (‘AVG’, black thicker line) is added to the graph as a point of reference.

