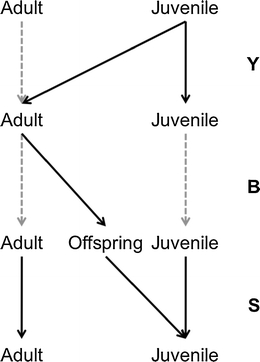
Fig. 3.

Periodic life cycle graph resulting from the annual life cycle as shown in Fig. 2. The life-cycle includes three phases: (1) juveniles mature and become adults, (2) adults reproduce, and (3) individuals survive. The gray dashed line indicates probability of one. See text for a description of transitions matrices that appear on the right
