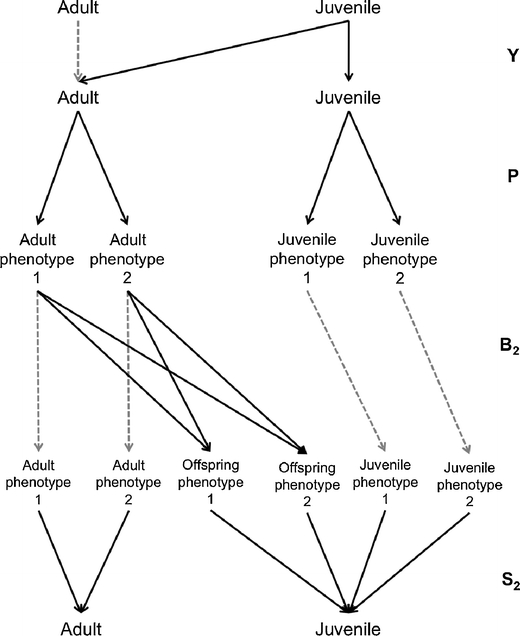
Fig. 4.

Periodic life cycle graph including the relationships between phenotypic traits and demographic rates. There are four phases with phase 1 is identical to the one shown in Fig. 2. Individuals are classified into phenotypic stages during phase 2 and produce new phenotypes during phase 3. During phase 4, individuals survive and are classified as adults or juveniles
