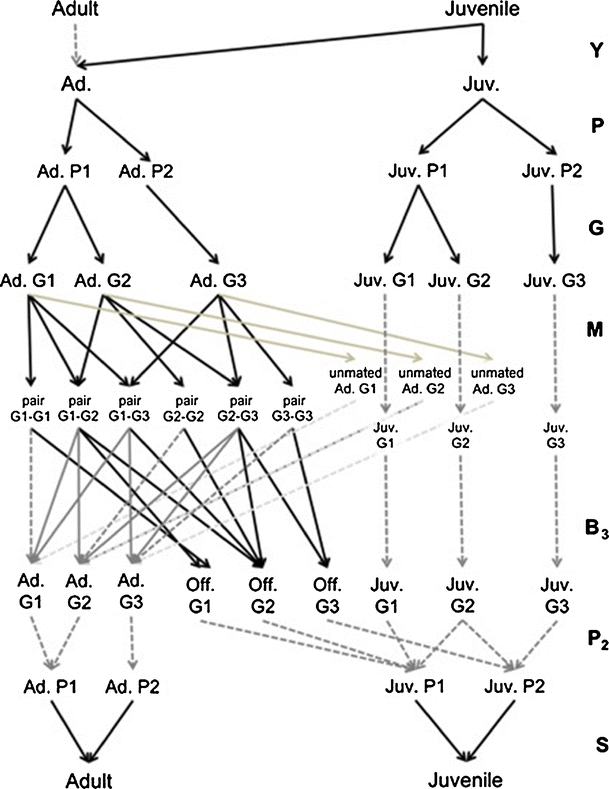
Fig. 5.

Periodic life cycle graph including the relationship between genotype and phenotype. There are seven phases. The two first phases are identical to the ones shown in Fig. 3. Individuals are classified into genotype stages during phase 3. For sake of simplicity, we assume that phenotype 1 is a dominant trait controlled by a single set of alleles. Thus, phenotype 1 is seen in both the homozygous G1 and heterozygous G2 genotypes. During phase 4, adults can mate forming a mating pair with a specific combination of genotypes or they can remain unmated adults. During phase 5, mating pairs produce new individuals with specific genotypes. Then, during phase 6, individuals are classified into phenotype stages, and during phase 7 they survive and are classified as adults or juveniles
