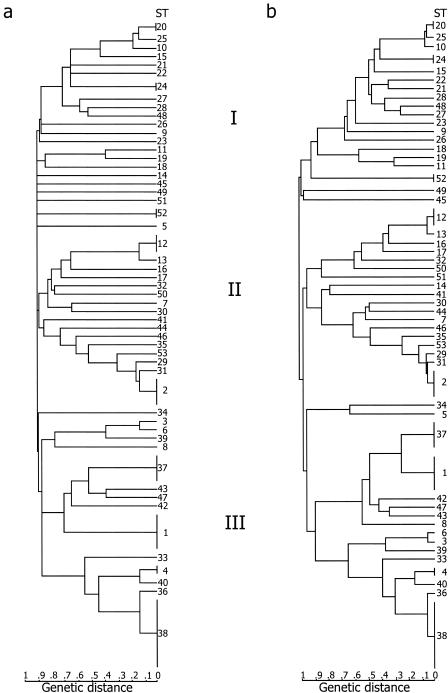
FIG. 1.
Genetic relationships among 77 isolates of the B. cereus group. Strains were clustered by UPGMA applied to a distance matrix of pairwise differences between allelic profiles. Alleles were identified either for entire gene fragments (Table 4) (a) or after fragments were split into three equal-length parts (Table 5) (a). The scale bars indicate the percentages of mismatches between allelic profiles.

