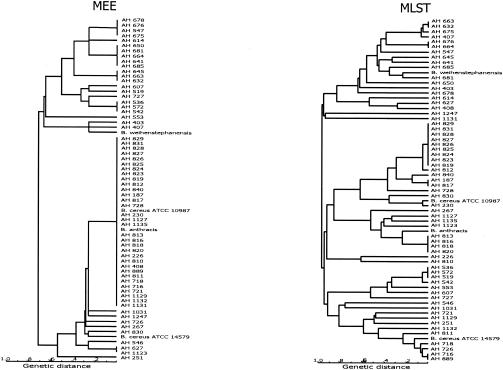
FIG. 3.
Comparison of MEE and MLST data for a subset of 67 B. cereus group isolates (out of the 77 strains used in this study). Both dendrograms were generated by the UPGMA method from a matrix of coefficients of genetic distances. The scale bars indicate the percentages of allelic differences between electrophoretic types for MEE and between STs for MLST. The MEE dendrogram was based on 13 enzyme loci as described previously (11-13).

