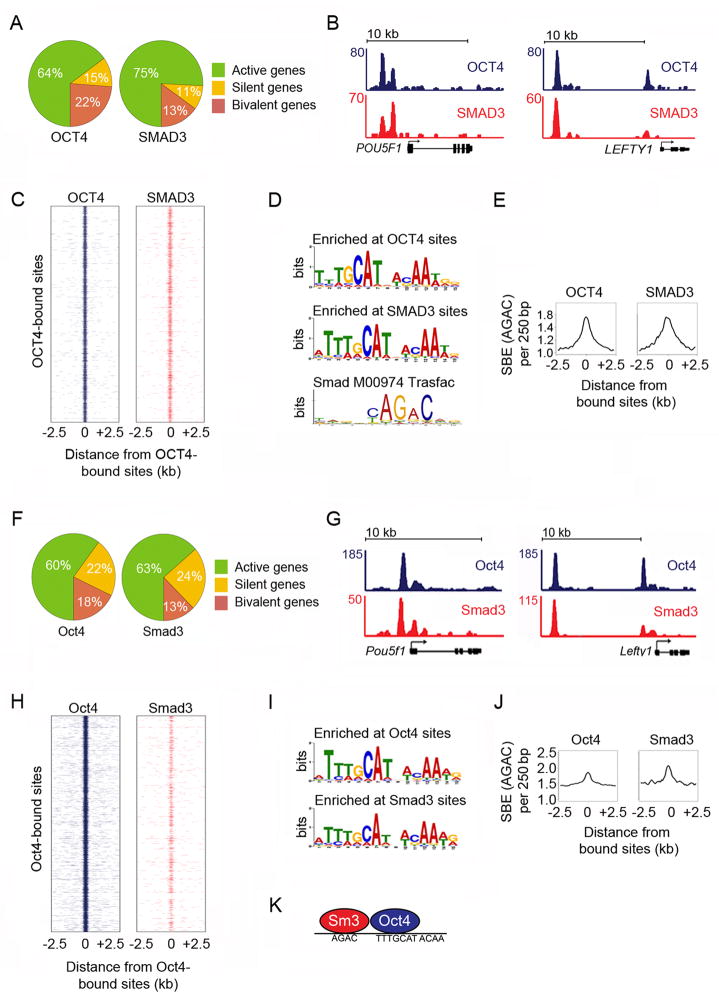
Figure 1. SMAD3 and OCT4 co-occupy the genome in ES cells.
(A) Distribution of genes bound by OCT4 (left) and SMAD3 (right) across active, silent and bivalent genes in hES cells (Table S3). In all experiments, hES cells were grown in mTESR1 media, which contains TGF-β. Refer to Extended Experimental Procedures for details of hES cell culture and gene assignments.
(B) SMAD3 and OCT4 co-occupy DNA sites in hES cells. Gene tracks represent binding of OCT4 (blue) and SMAD3 (red) at POU5F1, the gene encoding OCT4 (left) and LEFTY1 (right). The x-axis represents the linear sequence of genomic DNA and the y-axis represents the total number of mapped reads with the floor set at 2 counts unless specified otherwise. The genomic scale in kilobases (kb) is indicated above each track.
(C) SMAD3 and OCT4 co-occupy the genome. Binding plots show the location of OCT4- (left) and SMAD3- (right) bound sites relative to 7,532 OCT4-bound sites. For each OCT4-bound site (y-axis) the presence of OCT4 (blue) and SMAD3 (red) sites are displayed within a 5 kb window centered on the OCT4-bound site. Intensity at position 0 indicates that sites overlap.
(D) SMAD3 binding sites are enriched for the OCT4 motif. The most enriched motifs at OCT4-bound sites (top) and SMAD3-bound sites (center) were identified using MEME (Bailey and Elkan, 1994) (Fig S1). The canonical Smad Transfac motif (Smad binding element) (Matys et al., 2003) is shown.
(E) The Smad binding element (SBE) is enriched at both OCT4- and SMAD3-bound sites. The histogram shows the average occurrence of the canonical SBE in a 250 bp window (y-axis) relative to the distance from the peak (x-axis) of OCT4- (left) or SMAD3-bound sites (right).
(F) Distribution of genes bound by Oct4 (left) and Smad3 (right) across active, silent and bivalent genes in mES cells. All mES cells analyzed in Fig 1 were grown for 2 passages off feeders without addition of exogenous Activin or TGF-β (see Extended Experimental Procedures). The TGF-β signaling pathway is active under these standard mES cell culture conditions (Fig S1C).
(G) Oct4 and Smad3 co-occupy DNA sites in mES cells. Gene tracks represent binding of Oct4 (blue) and Smad3 (red) at Pou5f1 (left) and at Lefty1 (right).
(H) Smad3 and Oct4 co-occupy the genome. For each of the 15,003 Oct4-bound sites (y-axis) the presence of Oct4 (blue) and Smad3 (red) are displayed within a 5 kb window centered on each Oct4-bound site.
(I) Smad3 binding sites are enriched for the Oct4 motif. Motif discovery was performed using the murine Oct4 and Smad3-bound sites.
(J) The SBE is enriched at both Oct4 and Smad3-bound sites. The histogram of canonical SBE frequency (y-axis) was generated as described in E using murine Oct4 (left) and Smad3 sites (right).
(K) Smad3 (Sm3) and Oct4 co-occupy the genome in ES cells by binding nearby DNA sites. The binding motif for each factor is displayed. See also Figure S1, Table S1–S2.

