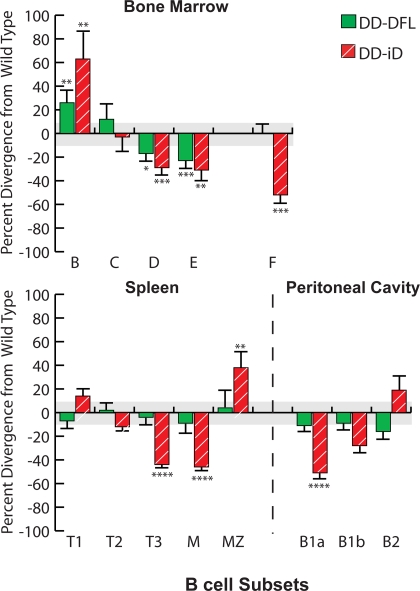
Figure 5.
Divergence in the absolute numbers of B lineage subpopulations from the bone marrow, spleen, and peritoneal cavity of homozygous ΔD-iD and ΔD-DFL mice relative to their littermate controls. Percent loss or gain in homozygous ΔD-iD and ΔD-DFL mice relative to WT littermate controls in the average absolute number of cells in bone marrow fractions B (CD19+CD43+HSA+BP-1−), C (CD19+CD43+HSA+BP-1+), D (CD19+CD43−IgM−IgD−), E (CD19+CD43−IgM+IgD−), and F (CD19+CD43− IgMlo IgDhi); in splenic transitional T1 (CD19+AA4.1+sIgMhi-CD23−), T2 (CD19+AA4.1+sIgMhiCD23+), T3 (CD19+AA4.1+sIgMloCD23+), marginal zone (MZ, CD19+CD21hiCD23lo), and mature (M, CD19+CD21loCD23hi) B cell subsets (references 46, 47); and in peritoneal cavity B1a (CD19+CD5+), B1b (CD19+CD5−Mac-1+), and B2 (CD19+CD5−Mac-1−) (Table I and Figs. S1–S4). The standard error of the mean of each B lineage subpopulation for the littermate controls averaged ∼11% of the absolute number of cells in each subpopulation (gray area). For ΔD-iD and ΔD-DFL, the standard error of the mean is shown as an error bar. *, P ≤ 0.05; **, P ≤ 0.01; ***, P < 0.001; and ****, P < 0.0001.

