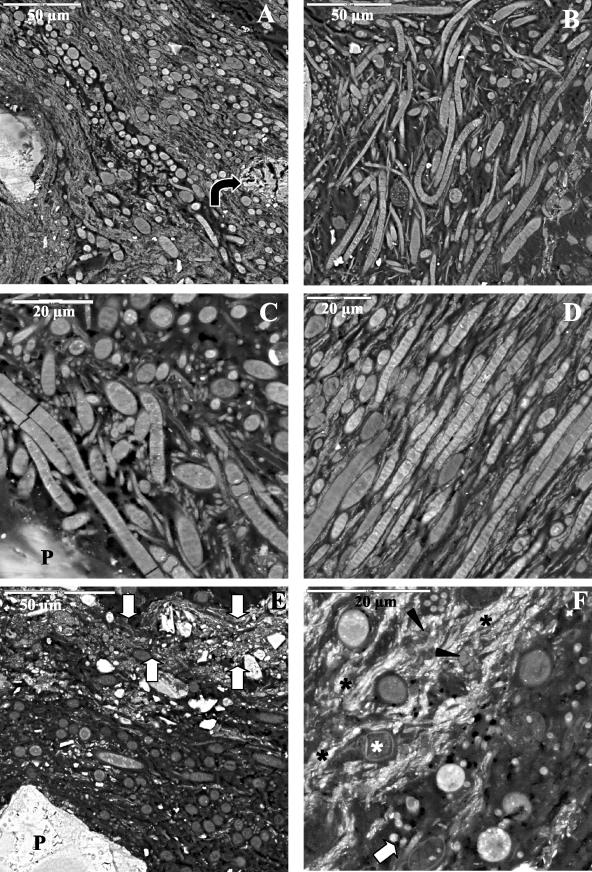
FIG.5.
SEM-BSE micrographs of Black Dot Pond (A to D) and Casten Pond (E and F) mats. (A) General view of cyanobacterium-rich layer. The arrow indicates a calcium carbonate precipitate. (B) General view of the upper part of the mat. (C) Nodularia, Leptolyngbya, and Phormidium intermixed in the proximity of a sediment particle (P). (D) Heterocystous Nodularia and Phormidium cells oriented parallel to the surface and intermixed with bands of small mineral grains. (E) General view of the upper half of the mat. The arrows indicate a thin layer of small mineral deposits at the top of the mat. P, sediment particle. (F) Transverse section of thick filamentous cyanobacteria, Leptolyngbya filaments (white arrow), diatoms (white asterisk), and bacteria (arrowheads) immersed in an accumulation of fine mineral deposits (black asterisks) localized in the bottom part of the cyanobacterium-rich layer.

