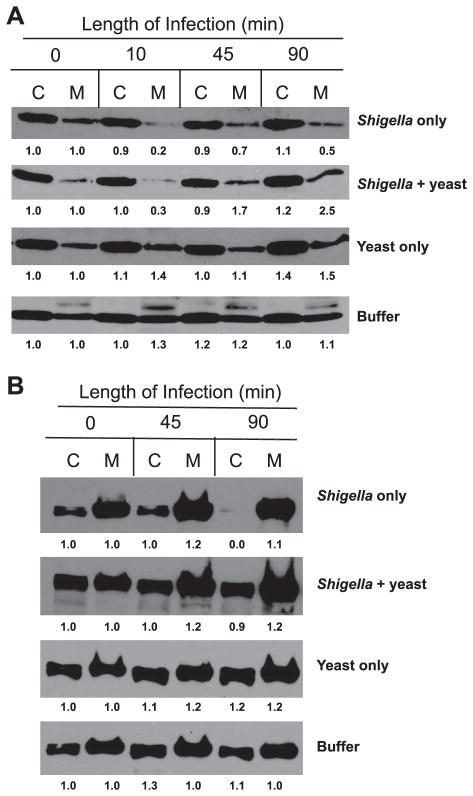
Fig. 3.
Representative Western blots for 2 individual tight junction proteins following a time course of apical infection with S. flexneri in the absence and presence of S. boulardii. C, cytosolic (Triton X-100 soluble) fraction; M, membrane (Triton X-100 insoluble) fraction. Thirty micrograms of protein were loaded per well. Densitometry was performed using ImageJ software (38). The fold change is displayed below each band and was calculated with respect to the change from uninfected, unexposed monolayers (buffer control) at time 0 within each individual Western blot. A: claudin-1 (22 kDa). B: zonula occluden (ZO)-2 (160 kDa). Western blots shown represent 1 of at least 3 independent experiments performed with similar results.

