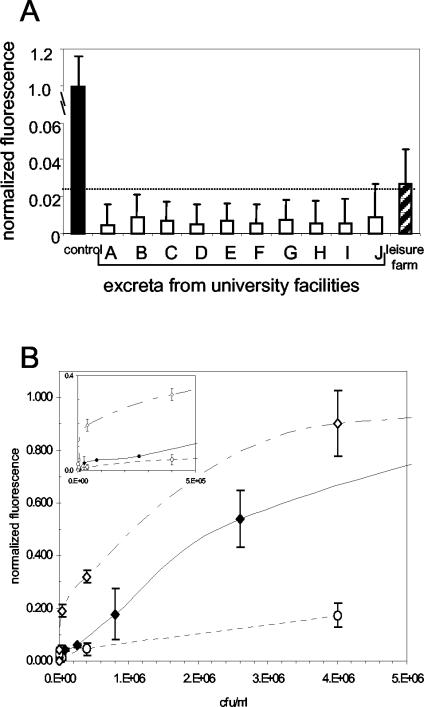
FIG. 4.
Detection of S. enterica serovar Typhimurium in chicken excreta. In both panels, values shown on the ordinate are mean normalized fluorescence values (± SEM; n = 10) from duplicate slides. (A) Unspiked excreta. Black bar, positive control (107 CFU/ml in buffer); white bars, samples from university facilities; striped bar, pooled sample from the leisure farm. The horizontal line (dashed) indicates the threshold value for determining the LOD. (B) Dose-response curves for spiked excreta. Open diamonds, excreta from university-raised chickens; circles, excreta from leisure farm-raised chickens. The dose-response curve for S. enterica serovar Typhimurium in buffer (closed diamonds) is shown for comparison. The inset shows the sensor responses for concentrations of spiked S. enterica serovar Typhimurium of <5 × 10⁵ CFU/ml.

