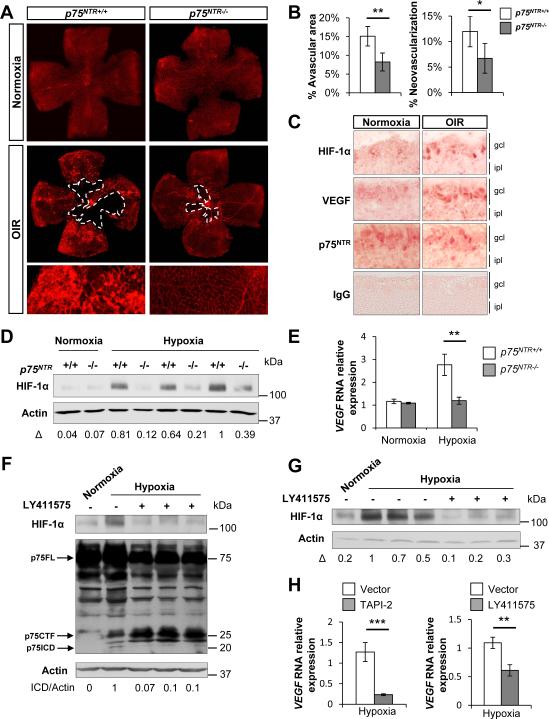
Figure 6. Loss of p75NTR Reduces HIF-1α Stabilization and VEGF Expression and Regulates Neovascularization in Retinal Hypoxia.
(A) Whole-mount retinas from WT and p75NTR−/− P17 mice exposed to normoxia or OIR were stained with the vascular marker Alexa-Fluor 594–conjugated isolectin B4 from Griffonia simplicifolia. Dashed lines outline the vaso-obliterated area.
(B) Quantification of the vaso-obliterated area and neovascular tuft formation in normoxia in WT and p75NTR−/− mice (n=3 per genotype) or in hypoxia WT (n=8) and p75NTR−/− mice (n=9). Results are presented as mean ± SEM. (*P<0.05 and **P<0.01, by unpaired Student's t test). Analysis was performed on animals from 3 independent litters.
(C) Immunohistochemical staining for HIF-1α, VEGF and p75NTR in normoxia and hypoxia in the central retina of P12 mice 12 hours after OIR. gcl, ganglion cell layer; ipl, inner plexiform layer.
(D) Western blot for HIF-1α in normoxic and hypoxic retinas of WT and p75NTR−/− P12 mice 6 hours after return to room air. β-Actin loading controls were performed on the same membrane. Three mice from n=3 independent litters are shown.
(E) Real-time PCR analysis of VEGF gene expression in WT and p75NTR−/− P12 mice 6 hours after return to room air. WT normoxia, n=3; p75NTR−/− normoxia, n=5; WT hypoxia, n=9; p75NTR−/− hypoxia, n=9; **P<0.01 by one-way ANOVA. Values are mean ± SEM. Analysis was performed on animals from three independent litters.
(F) Western blot for p75NTR and HIF-1α in normoxic and hypoxic retinas of WT P12 mice treated with LY411575 or vehicle. β-actin loading controls were performed on the same membrane. p75ICD is detected in lane 2. Representative western blot is shown from an average of n=6 animals in each experimental condition.
(G) Western blot for HIF-1α in normoxic and hypoxic retinas of WT P12 mice treated with LY411575 or vehicle. β-actin loading controls were performed on the same membrane. Representative western blot is shown from an average of n=6 animals in each experimental condition.
(H) Real-time PCR analysis of VEGF gene expression in WT P12 mice treated with TAPI-2, LY411575 or vehicle. WT vehicle, n=5; WT TAPI-2, n=6; WT LY411575, n=6; **P<0.01, ***P<0.001 by unpaired Student's t test. Values are mean ± SEM. See also Figure S4.

