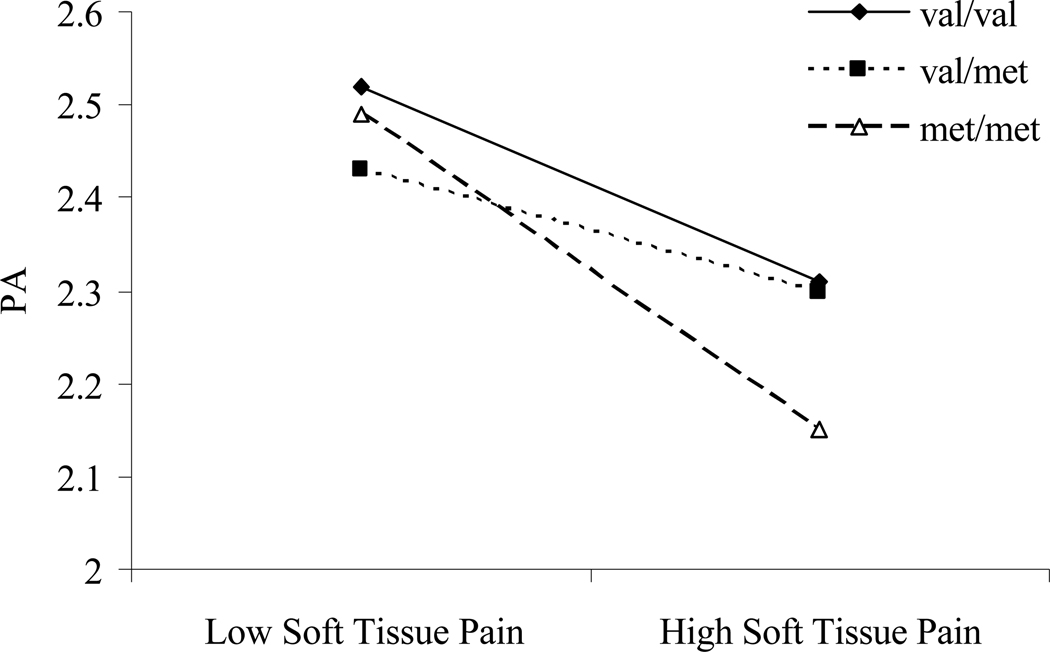
Figure 1. COMT × pain interaction.
Slopes reflect positive affective reactivity to high versus low pain days for patients with either val/val, val/met, or met/met genotypes. X-axis parameters were generated by dichotomizing centered pain scores into the top and bottom third of responses across participants.

