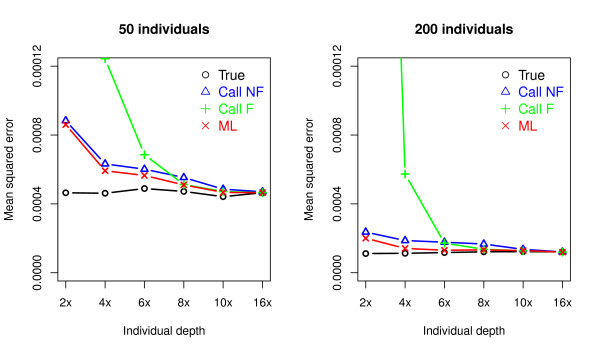
Figure 2.
Mean squred error (MSE; Expected  ) of four different types of allele frequency estimators for different sample sizes (left and right panel) and depths of coverage (x-axis). At each depth, MSE was computed from the allele frequency estimates made using four different methods: True, Call NF, Call F, and ML (for details of the methods, see the caption of Figure 1).

