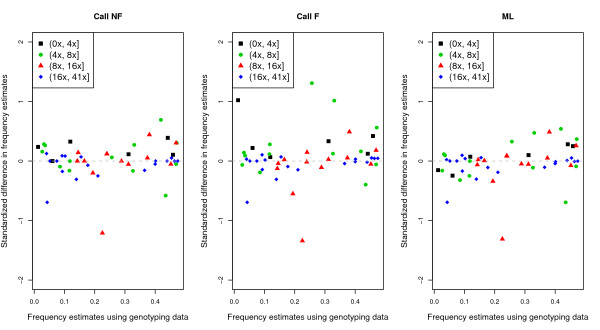
Figure 6.
Estimates of allele frequency computed from 200 individuals using next-generation sequencing data vs. Sequenom genotype data. At each site, only individuals that have both Sequenom genotype data and sequencing data were used for estimation of allele frequency. For the sequencing data, estimates of MAF were obtained using three different methods (Call NF; Call F; and ML). The standardized difference for each estimate was computed as  , where
  and
and  are the estimated MAFs from the sequencing data and Sequenom genotype data, respectively, and n is the number of individuals used for the estimation. Each site is classified into one of four bins based on average individual depth of coverage (color): less than 4×, higher than 4× but less than 8×, higher than 8× but less than 16×, and higher than 16×.

