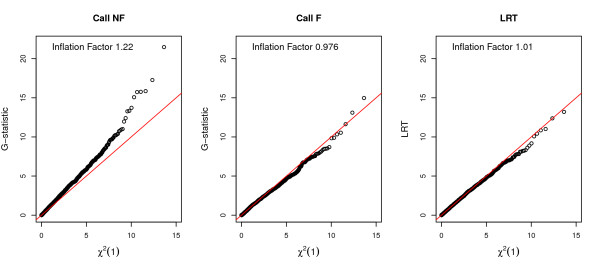
Figure 8.
QQ-plots comparing the association test statistics for allele frequency differences between 100 cases and 100 controls to a χ2(1) distribution. Phenotypes were randomly assigned to indivdiduals in the exome resequencing dataset such that there are 100 cases and 100 controls. For each site, three statistics were computed: the G-statistic using called genotypes without filtering (Call NF), the G-static using called genotypes with filtering (Call F), and the LRT statistic. To minimize inclusion of false SNPs, sites with ML MAF estimates less than 2% are discarded. For display purposes, results from sites on chromosome 2 are shown. Note that the inflation factor is shown in the upper left corner of each QQ-plot.

