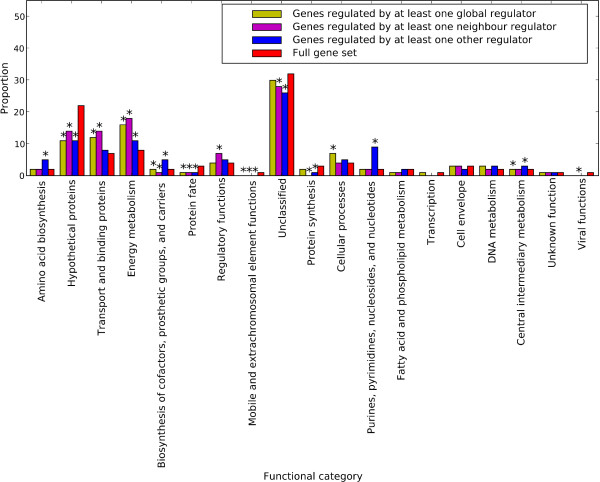
Figure 7.
Distribution of genes among JCVI functional categories for E. coli K12 genes. Shown for each functional category are proportions of genes regulated by global regulators, by neighbour regulators, and by other non-global regulators. Those significantly over- or underrepresented (P < 0.05, by Fisher's exact test) vis-a-vis their frequency in the full set of E. coli K12 genes are marked with an asterisk.

