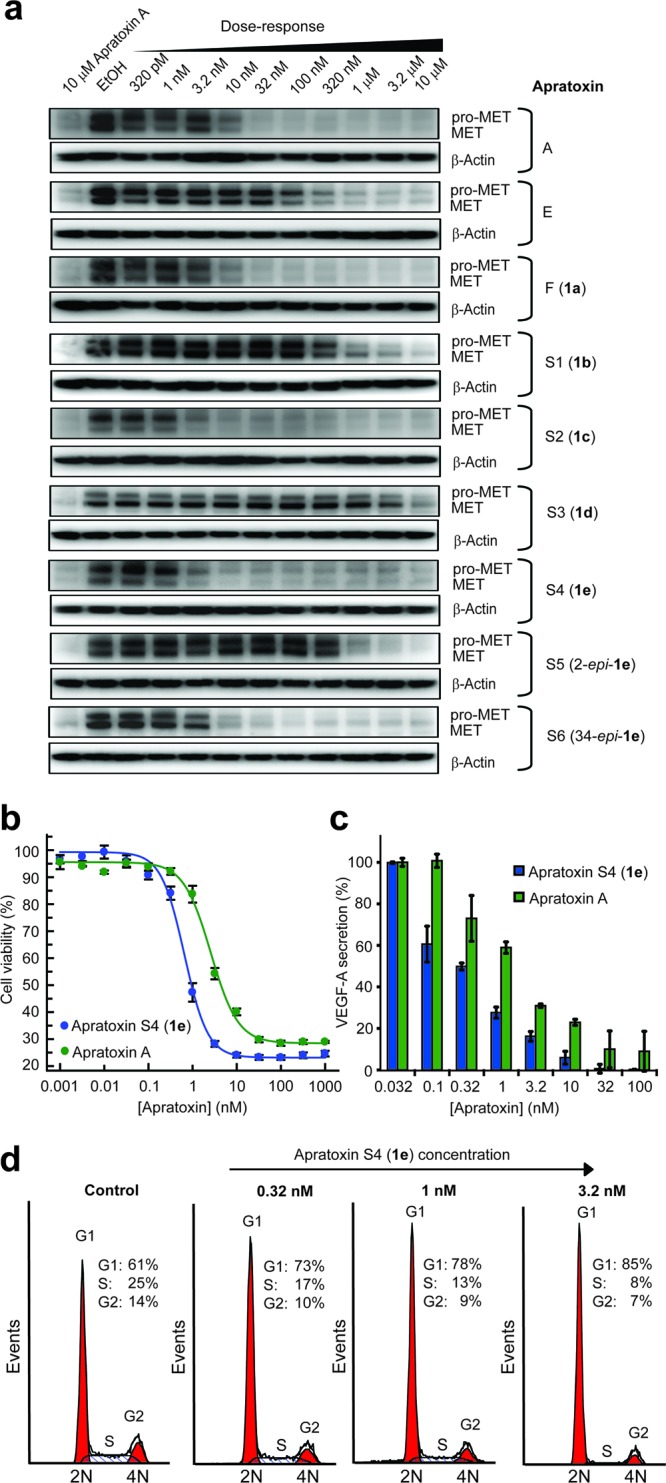
Figure 2.

Cellular activity of apratoxins (HCT116 cells). (a) SAR by immunoblot analysis for RTK levels (MET) after 24 h. Comparison of apratoxin A and S4 (1e) effects on (b) cell viability (48 h, n = 4) and (c) VEGF-A secretion (12 h, n = 3). Error bars indicate SD. (d) Dose-dependent cell cycle effects of 1e determined by DNA content analysis, demonstrating induction of G1 arrest (24 h).
