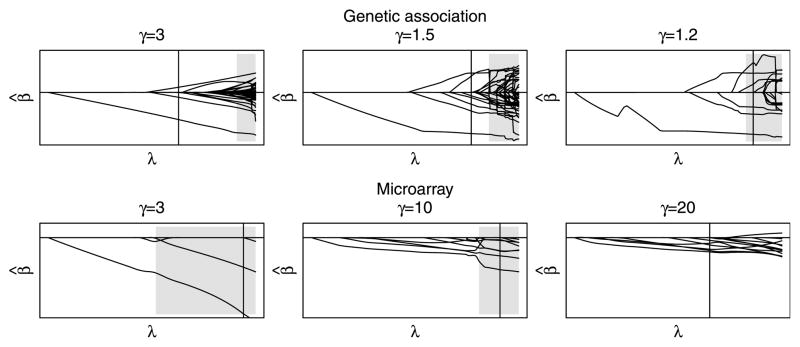
Fig. 5.
MCP coefficient paths for various values of γ for the two studies of Section 6. The shaded region depicts areas that are not locally convex, and a vertical line is drawn at the value of λ selected by BIC. For the sparse genetic association data, small values of γ produce the best fit; for the dense microarray data, large values are preferred.

