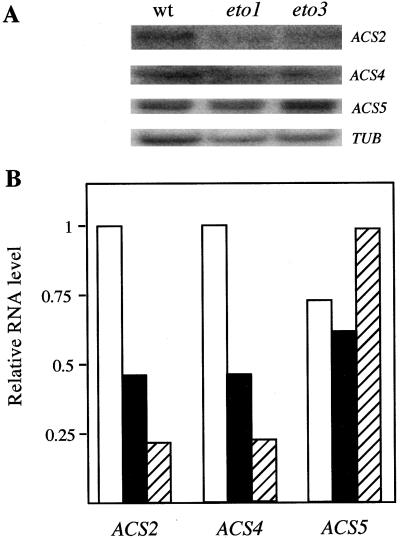
Figure 7.
RNA-blot analysis of ACS mRNA levels in etiolated seedlings. Five micrograms of poly(A+) RNA from 3-d-old wild-type (open bars), eto1 (closed bars), and eto3 (hatched bars) seedlings was separated by agarose-gel electrophoresis, blotted to a nylon membrane, and hybridized to an ACS2, ACS4, ACS5, or β-tubulin (TUB) probe. A, The original images of the blots. B, The quantification of the blots in A. The signal from each band was quantified using a phosphor imager. The value for each ACS band was divided by its β-tubulin loading control. The highest level in each set was assigned a value of 1, and the other values are expressed relative to this. The ACS5 blot was from an independent RNA blot and was normalized to its own β-tubulin loading control (not shown).

