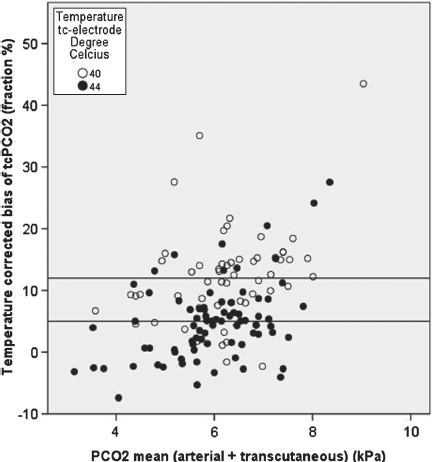
Figure 3.

This figure shows the mean pCO2 (kPa) versus the temperature corrected bias of TcPCO2 (fraction, %). The horizontal lines show the mean bias of TcPCO2 at 40°C (12%) and 44°C (5%). Correction with 12-15% when using 40°C will approximate measurements to the arterial pCO2.
