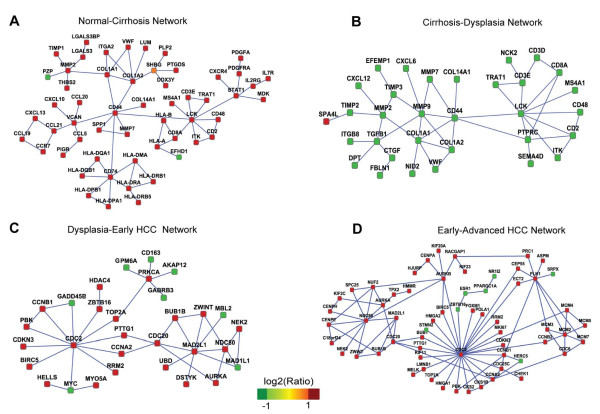
Figure 1.
Giant component of each stage specific network. A, Normal-Cirrhosis network. B, Cirrhosis-Dysplasia network. C, Dysplasia-Early HCC network. D, Early-Advanced HCC network. Nodes in the network represent genes and edges represent their interactions. Node colour is scaled to gene expression fold change between two consecutive stages.

