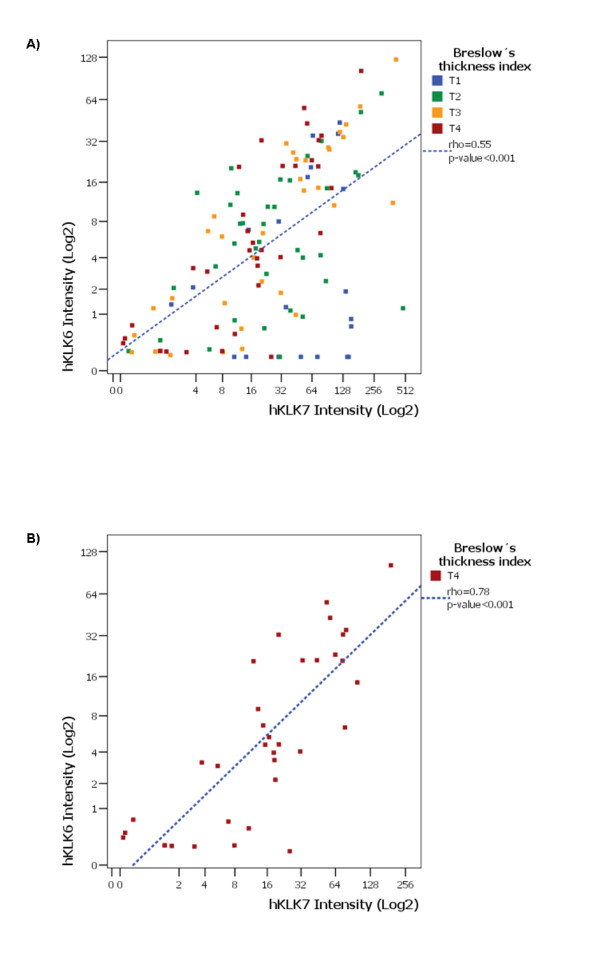
Figure 4.

Spearman's rho correlation analysis between expression levels of hKLK6 and hKLK7 in human PCM samples. Scatter-plots showing a moderate Spearman's rho correlation coefficient (blue line) between the expression levels of hKLK6 and hKLK7 in PCM (0.3 to 19.5 mm in depth) samples (A), and in thick PCM samples (depth > 4.0 mm) (B).
