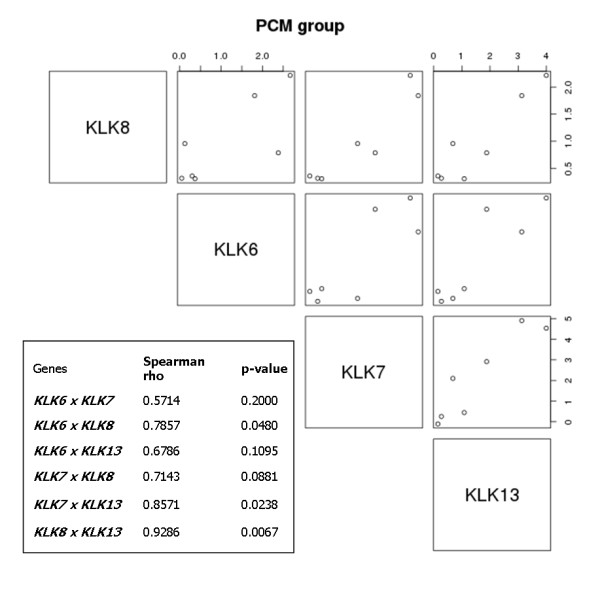
Figure 5.

Validation of the correlations among hKLK mRNA expression in an independent PCM dataset. Scatter-plots showing Pearson's correlation coefficient between the mRNA expression levels of hKLKs in PCM samples. Each graph shows the expression of two kallikreins (the one in the left and the one below the graph) in all samples. The table shows correlation coefficient and the respective p-value for each kallikrein pair.
