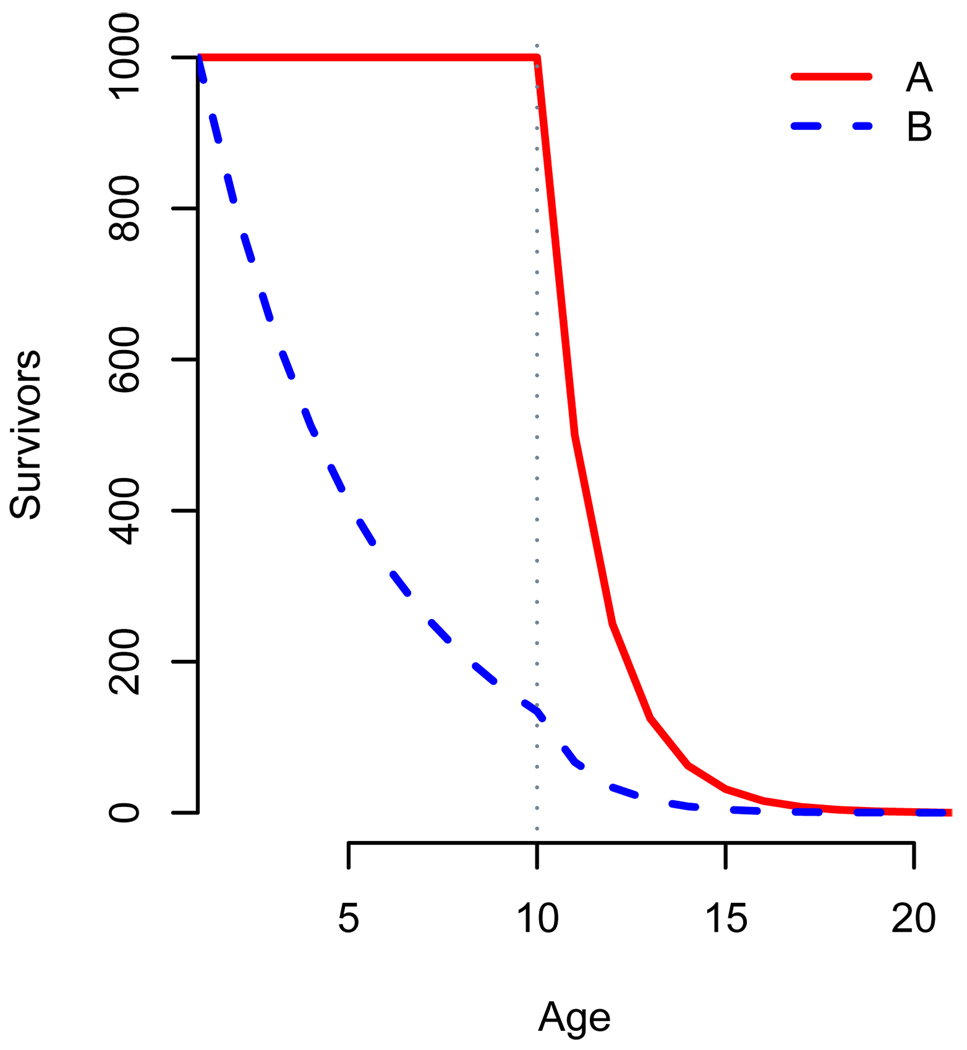
Figure 1.
Age-specific survival for populations with identical Post-reproductive Times are shown. Populations A (red line) and B (blue dashed line) both begin reproducing at age=0, reach reproductive cessation at age=10, and both experience 50% annual mortality in years 10 and above. Population A experiences no mortality prior to reproductive cessation, while Population B experiences 20% annual mortality. 16.6% of years lived by population A are post-reproductive, compared to 4.5% of years lived by B. However, PrT for each population is one year. For both these populations the ratio of PrT to fertile lifespan is 1/10.

