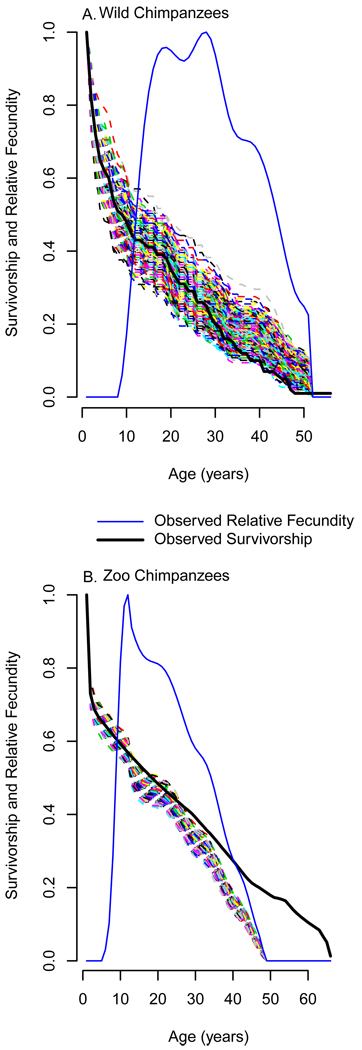
Figure 3.
A null hypothesis for Post-reproductive representation (PrR) is generated by altering the observed survivorship curve (solid black line), such that its decline after the age of maximum fecundity is proportional to the decline of age-specific fecundity (solid blue line). This new curve is employed to calculate yearly survival probabilities (px) for a population in which survivorship and fecundity decline in parallel. 1000 populations are simulated using these altered survival probabilities. PrR is calculated for each, generating the null distribution against which the observed value can be compared. We illustrate this process for two chimpanzee populations. Each dashed multicolored line is the survivorship curve (lx) for a single simulated population. Wild chimpanzee (A) survivorship decline is at the low end of their null distribution. Zoo chimpanzees (B) live significantly longer than is expected based on their rate of reproductive senescence. The larger sample size in B leads to a tighter null distribution.

